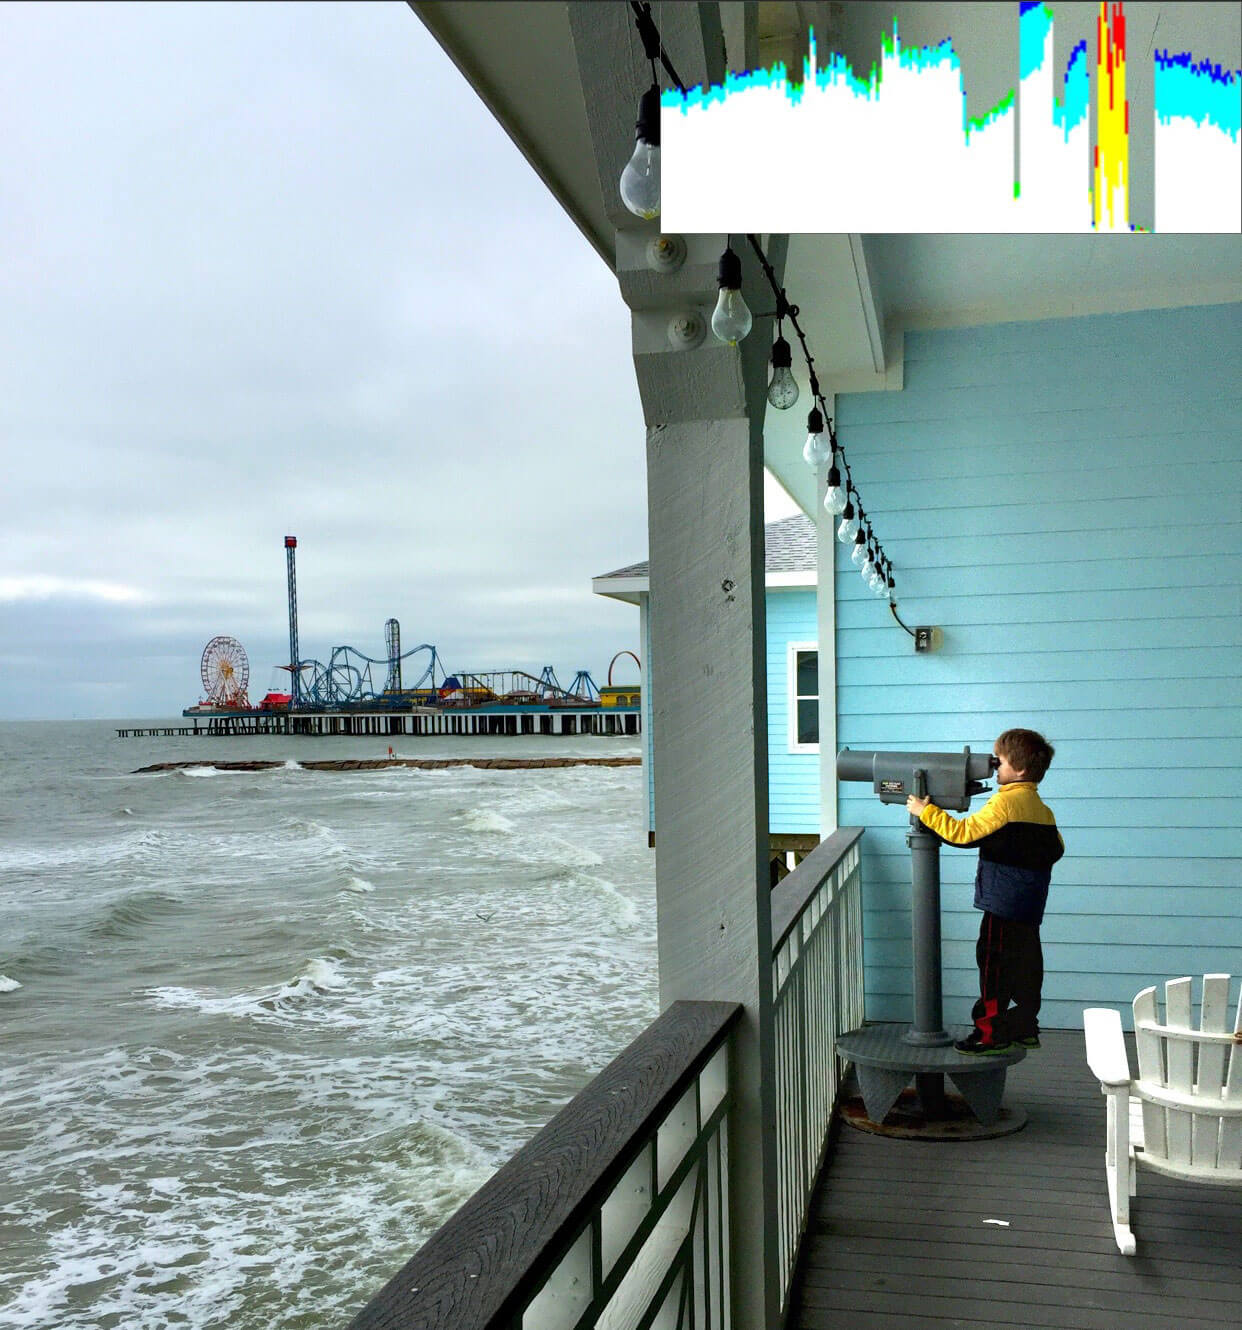
The histogram shows you a graphed representation of the colors and brightness in your image. Pic Ninja's histogram works a little different than other histograms you may be used to. It shows a vertical representation of color and brightness intensity. So for instance as the white peak approaches the top of the graph it is moving more towards pure white in the corresponding part of your photo. Depending on where the peaks appear in the graph is the part of the image it is displaying. For instance a peak on the left side of the graph corresponds with the left side of the image. A peak on the right side of the image would correspond to the right side. In this way you can obtain more useful information about the colors in your image. You can double tap to turn this feature off and on or access it in the settings.